

2. Monitors
2.1. Processes
The Processes menu presents a table that shows the status of current and historical runs. Table is showing:
- Load Id
- Processing data
- Time of start of the processing
- Optional restart time
- Finish time
- Duration of the processing
- Status: B - success, B – error, R – Restarted
- RC – Return code: 0 for Success.

You can click on the icon on the left to show the summary of each processing:

and the Process Map:

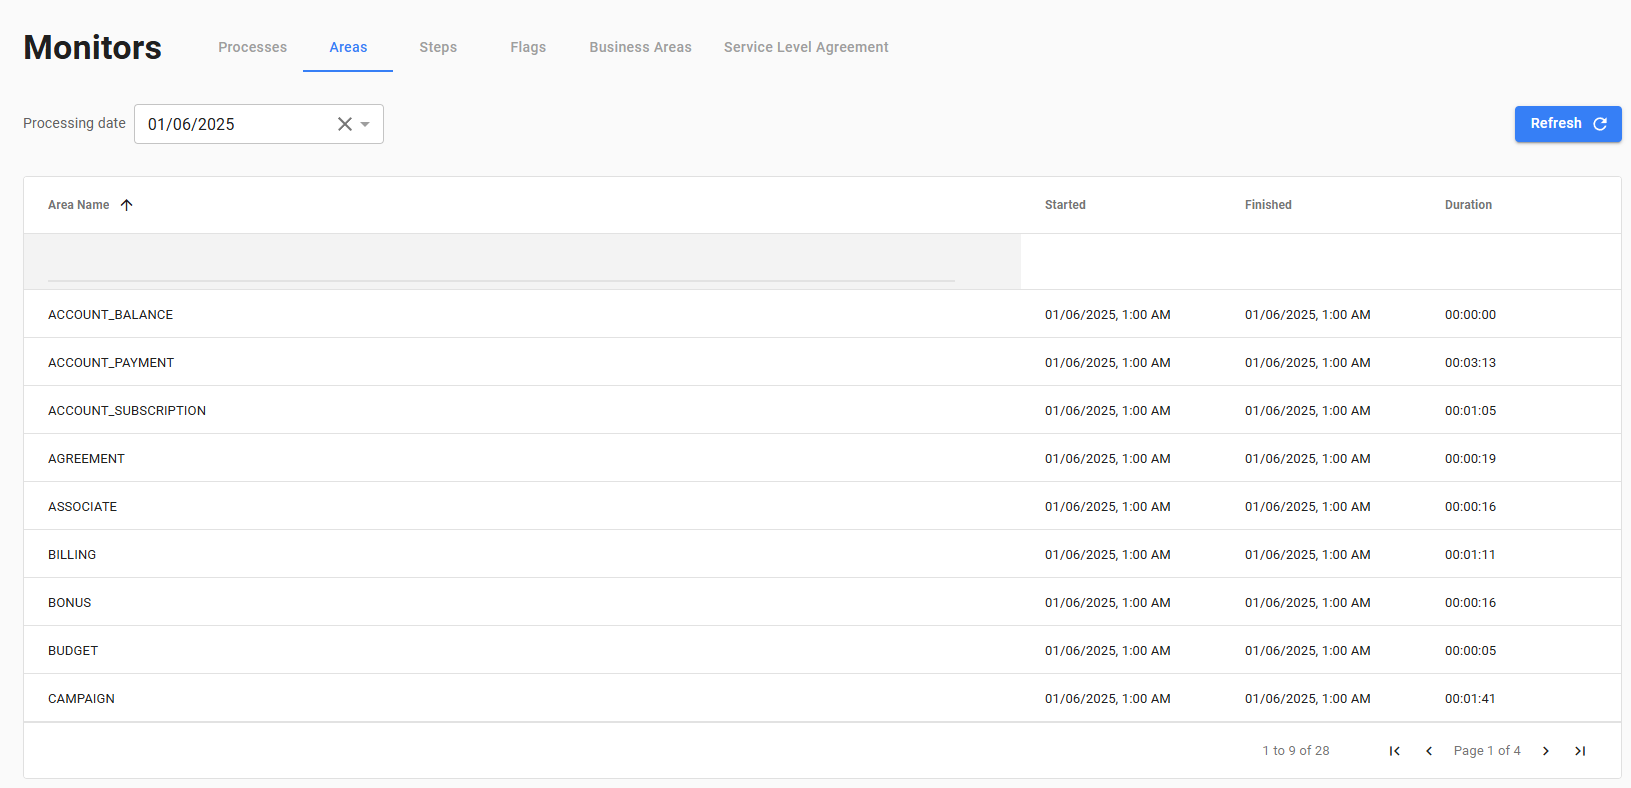
2.2. Areas
The Areas menu presents a table that shows the status of current and historical runs by Area. Table is showing:
- Filter where you can choose Area Name and Processing date.
- Table showing: Area name, Start time, End time, and Duration.
2.3. Steps
The Steps menu presents a table that shows the status of current and historical runs by Area. Page is showing:
- Filter where you can choose Step Name and Processing date, Area.
- Table showing: Step name, Area name, Start time, End time, Duration,Indication if step was on CP, Return Code.

You can click on icon on the left to show the details of each step:
- Log of the step:

You can also click on “History” link. It will show the 30 days of history of the process duration by day.
2.4. Flags
The Flags menu presents a table that shows the status of current and historical Flags sent to the Core Auto by external producers. Page is showing:
- Filter where you can choose Flag Name, Producer System, date.
- Table showing: Flag name, Source system (Producer), Processing time, Dateof the creation.
2.5. Business Areas
The Business area menu presents a table that shows the status of current Business area processing status. Page is showing:
- Filter where you can choose Business area name.
- Table showing: Business Area name, Business Area Description, Status and predicted or actual finish date.

You can click Button for request of creation new business area (TheBusiness Area Definition is created by Administrator):

2.6. SLA
The SLA menu presents a list of defined SLA. Page is showing:
- SLA name
- Status
- To time
- Level of the SQL
You can click the link left to the SLA name to see the details ofthe defined KPIs:

